 The Statistics of Shape.
 The Statistics of Shape.
We interpret shape in its naive sense. Among geometrical objects, all cubes have the same shape and all spheres have the same shape. More formally, we can say that two objects have the same shape provided that one object is the image of the other under a similarity transformation of space. A similarity transformation is any transformation of space that can be written as the composition of a isotropic rescaling, a rotation (i.e., a special orthogonal transformation) and a translation.
Sometimes the objects have labels. In this case, we only say that they have the same shape when the similarity transformation maps labels on one object to the corresponding labels on the other. For example, two triangles ABC and A'B'C' have the same shape if the internal angle A equals the internal angle A', etc.
Another concept that is useful to define is the concept of form. Two objects have the same form if they have the same shape and are of the same size. Corresponding conventions apply to labelled objects.

Figure 1: A representation of the shape and form of a tetrahedron.
In nature, as opposed to the world of geometry, we cannot expect to find idealized shapes that are not subject to some arbitrary variation. For example, a crystal may well be cubical. However, it is never a perfect cube, especially when formed under the chaotic conditions imposed by gravity or turbulence. This is most apparent in the biological sciences, where the factors that lead to morphological variation include genetic factors, pre-natal environment (e.g., fetal alcohol syndrome), etc. The study of biological shape variation in its metrical aspects is called morphometrics. In fact, there is not one theory of shape but many theories, depending on the type of application and the type of mechanism postulated for shape variation.
Figure 2: The shapes of three Iron Age brooches from Switzerland encoded as tetrahedra.
Figure 3: Three aligned landmarks selected on four skull profiles. The shapes of each landmark triplet gives a partial summary of some shape information from each image. (Figure by Michael Lewis.)
Figure 4: Encoding the shapes of the aligned triplets using the geometry due to D. G. Kendall (1984). (Figure by Michael Lewis.)
Figure 5: Studying shape variation of the skulls using D'Arcy Thompson's method of coordinates.
After the landmark coordinates have been taken from each brooch, they are assembled into 28 matrices. Shape information is extracted from each matrix: First the form of the configuration is extracted by a Gram-Schmidt triangularization to an upper triangular matrix, as in Figure 1. Then the matrix is standardized multiplying by a scalar to eliminate the scale information in the form. One way to standardize is to rescale each matrix so that the determinant (i.e., the product of the diagonal terms of each U-T matrix) is one. In the following text file the standardization has been accomplished by rescaling so that the element in the upper left corner is one.
Next, for each of these upper triangular 3 x 3 shape matrices, we compute the shape distance between that pair, and enter that distance into the appropriate position of a 28 x 28 interbrooch distance matrix.
From this interpoint distance matrix, a principal coordinate analysis is performed, the horizontal axis showing the first principal coordinate, and the vertical axis showing the second.
3D <-->2D .
.
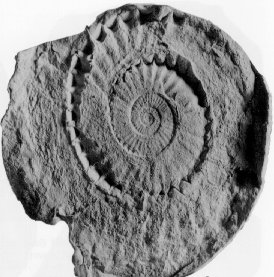
You can find out more about alpha shapes by going to the NCSA page on alpha shapes. The animation by Ping Fu that you see here is from that site.
To illustrate the alpha shapes software, consider the following image of a fossil ammonite shell from the lower Jurassic found in British Columbia.
![[BACK]](home.gif) Back to Christopher Small's home page .
Back to Christopher Small's home page .
![[BACK]](graph.gif) Back to the Statistics and Actuarial Science home page .
Back to the Statistics and Actuarial Science home page .
![[BACK]](UWlogo.gif) Back to the Math Faculty general information page .
Back to the Math Faculty general information page .
Back to the University of Waterloo home page .